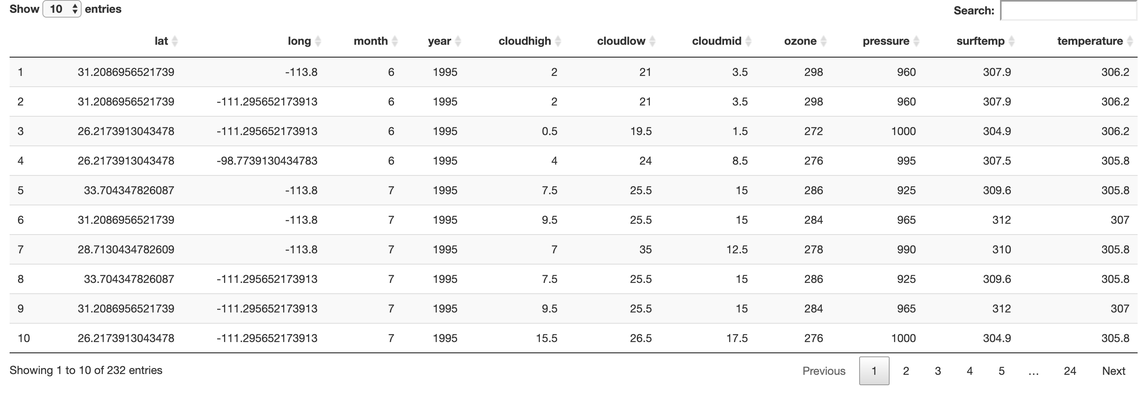
Most of the shiny apps have tables as the primary component. Now lets say you want to prettify your app and style the tables. All you need understand how tables are built using HTML. This is how the default datatable looks like in the app.
In order to build the html table I have used a function table_frame which can be used as a container in DT::renderdatatable.
This function basically uses htmltools. For more references on the basics of html tables please refer here
table_frame <-
  function() {
    htmltools::withTags(table(class = 'display',
                              thead(
                                tr(
                                  th(rowspan = 2, 'Latitude'),
                                  th(rowspan = 2, 'Longitude'),
                                  th(rowspan = 2, 'Month'),
                                  th(rowspan = 2, 'Year'),
                                  th(class = 'dt-center', colspan = 3, 'Cloud'),
                                  th(rowspan = 2, 'Ozone'),
                                  th(rowspan = 2, 'Pressure'),
                                  th(rowspan = 2, 'Surface Temperature'),
                                  th(rowspan = 2, 'Temperature'),
                                  tr(lapply(rep(
                                    c('High', 'Low', 'Mid'), 1
                                  ), th))
                                )
                              )))
  }
Tables might have n number of records and its not feasible to display them at once on dashboards. But someone might need to see them all at once. So in tableoptions where we can add two buttons show more and show less. Show less will use the default option of 10 records and show more will display all the records.
table_options <- function() {
  list(
    dom = 'Bfrtip',
    #Bfrtip
    pageLength = 10,
    buttons = list(
      c('copy', 'csv', 'excel', 'pdf', 'print'),
      list(
        extend = "collection",
        text = 'Show All',
        action = DT::JS(
          "function ( e, dt, node, config ) {
          dt.page.len(-1);
          dt.ajax.reload();}"
        )
        ),
      list(
        extend = "collection",
        text = 'Show Less',
        action = DT::JS(
          "function ( e, dt, node, config ) {
          dt.page.len(10);
          dt.ajax.reload();}"
        )
        )
        ),
    deferRender = TRUE,
    lengthMenu = list(c(10, 20,-1), c('10', '20', 'All')),
    searching = FALSE,
    editable = TRUE,
    scroller = TRUE,
    lengthChange = FALSE
    ,
    initComplete = JS(
      "function(settings, json) {",
      "$(this.api().table().header()).css({'background-color': '#517fb9', 'color': '#fff'});",
      "}"
    )
      )
}
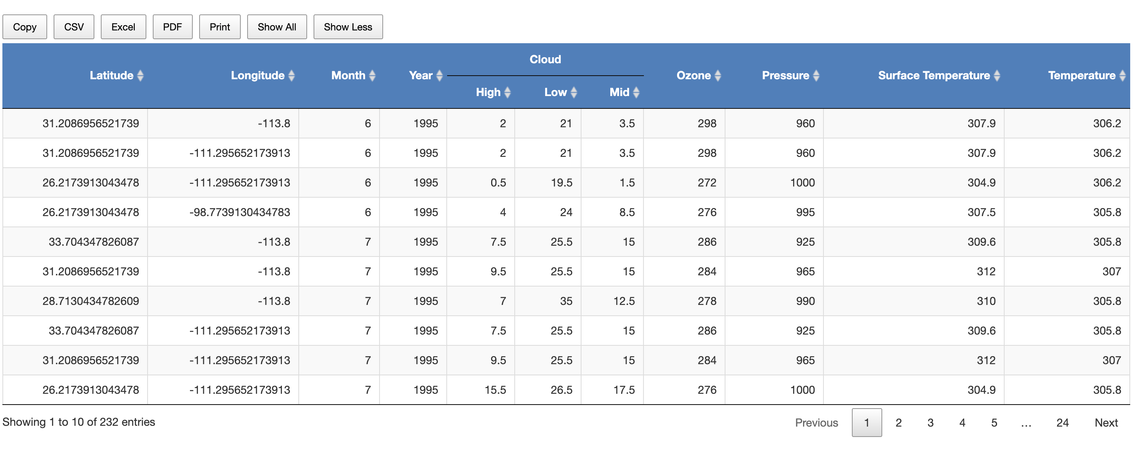
Below is the output how the datatable looks like once the html container and table options are used.So by stying not only can we change the column names but also group them. If you see the default table how we have three columns with prefix cloud. These can be grouped under one column name Cloud.
Code
You can find code for the app here.