Recently I visited Austin and many of my friends had mentioned about the variety in food options here. So my wife and I decided to search for places to eat on the foursquare app. As a standard search filter with high rating we ended up at pretty good places and foursquare did alert us to checkins whenever we reached a place. Post the trip I wanted to see how many people do checkins using this app and how the checkins are correlated with the ratings.
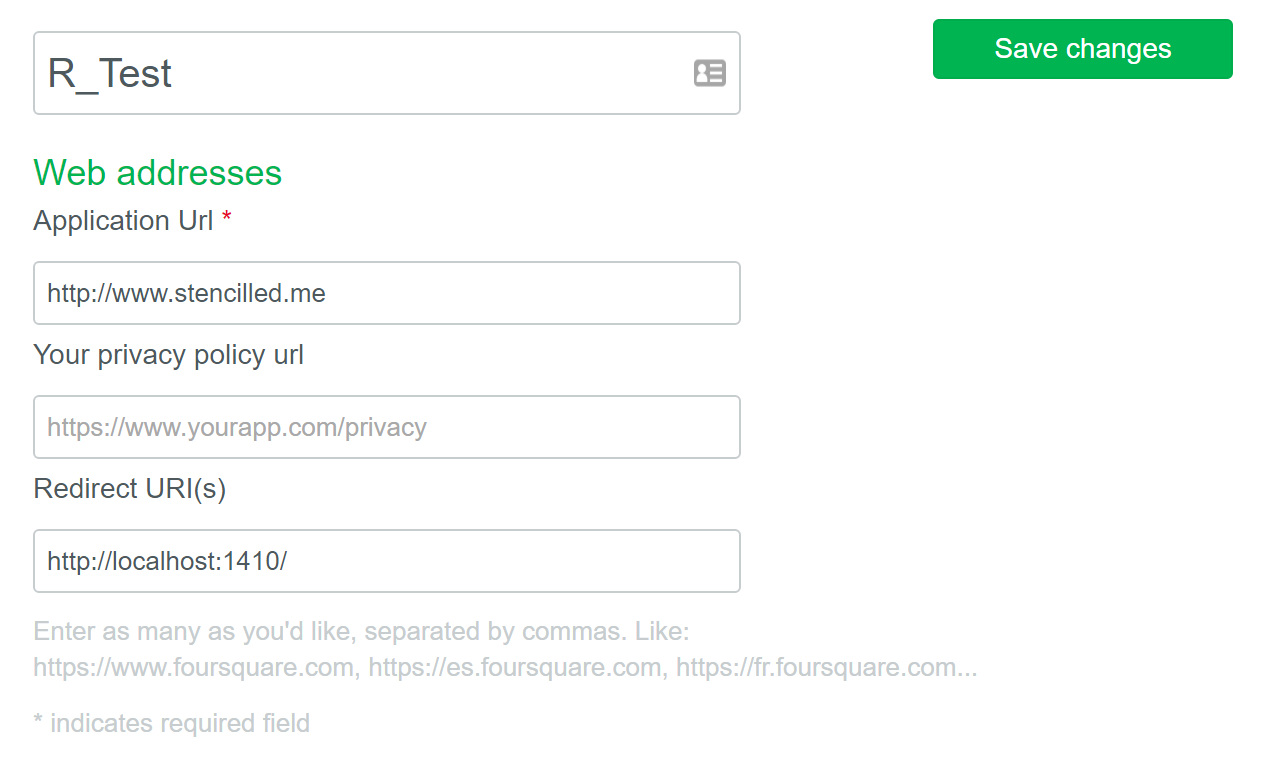
The first step here is to get the data . So I started to play around with the foursquare API and started working around the URL on what category(food,places to see, etc) to get the data . The authentication process for the foursquare API was a bit tricky but with my google-fu (( and special mention to the GIS tribe ) I was able to get going. Below is how you would get the client id and client secret when you create a new app.
The idea was how to do it for many places across the country. So I decided to use R to scrap and clean the data. You can find the code here.
library(RJSONIO)
library(RCurl)

options(RCurlOptions = list(cainfo = system.file("CurlSSL", "cacert.pem", package = "RCurl")))

# Obtained from http://notebook.gaslampmedia.com/download-zip-code-latitude-longitude-city-state-county-csv/
ll = read.csv('zip_codes_states.csv',sep=",",head=TRUE)
clientid = "ENTER YOUR CLIENT ID"
clientsecret = "ENTER YOUR CLIENT SECRET"

venue_name = c()
venue_lat = c()
venue_long = c()
venue_city = c()
venue_state = c()
venue_country = c()
venue_checkins = c()
venue_users = c()
venue_hasMenu = c()
venue_rating = c()
venue_postalCode = c()
venue_usersCount = c()
venue_formattedAddress = c()


# To go through the lat longs in the csv and get the data.
  for (i in 1:dim(ll)[1]) {
    lat = ll$latitude[i]
    long = ll$longitude[i]

    # Do query and parse results
     query = paste("https://api.foursquare.com/v2/venues/explore?client_id=",clientid,"&client_secret=",clientsecret,"&ll=",lat,",",long,"&query=food&v=20170131",sep="")
    result = getURL(query)
    data <- fromJSON(result)

    # For each result, save a bunch of fields, you can tweak this to your liking
    if (length(data$response$groups[[1]]$items) > 0) {
      for (r in 1:length(data$response$groups[[1]]$items)) {
        tmp = data$response$groups[[1]]$items[[r]]$venue
        venue_name = c(venue_name,tmp$name)
        venue_lat = c(venue_lat,tmp$location$lat)
        venue_long = c(venue_long,tmp$location$lng)
        venue_city = c(venue_city,tmp$location$city)
        venue_state = c(venue_state,tmp$location$state)
        venue_country = c(venue_country,tmp$location$country)
        venue_checkins = c(venue_checkins,tmp$stats[1])
        venue_hasMenu = c(venue_hasMenu,tmp$hasMenu)
        venue_rating = c(venue_rating,tmp$rating)
        # venue_shortName = c(venue_shortName,tmp$shortName)

      }
    }
  }

  # To Save the raw output
  save(venue_name,venue_lat,venue_long,venue_city,venue_state,venue_country,venue_checkins,venue_hasMenu ,venue_rating ,file='venuesResult.RData')


  # put this into a dataframe
  data = as.data.frame(cbind(locationvar,venue_checkins,venue_name,venue_lat,venue_long,venue_checkins,venue_users))

  # remove the  duplicate results
  dsub = subset(data,!duplicated(data))
  names(dsub) = c("latlong","checkins","name","latitude","longitude")

  # Export to file to csv which can be used for the next step.

  write.csv(tabley,file = "Austin_Foursquare.csv")
Once this was done the next part was to how do I visualize this data . Since I have been trying my hands on d3js I used the cleaned output from R in CSV format to display how checkins and ratings vary for these places using bubble chart.
           <script> src = "https://d3js.org/d3.v4.min.js" ></script>
           <!-- <link href="//fonts.googleapis.com/css?family=Raleway:400,300,600" rel="stylesheet" type="text/css"> -->
           <script src="https://cdnjs.cloudflare.com/ajax/libs/d3/4.4.4/d3.min.js" type="text/JavaScript"></script>
           <script src="https://cdnjs.cloudflare.com/ajax/libs/d3-queue/3.0.3/d3-queue.min.js"></script>
           <script src="https://cdnjs.cloudflare.com/ajax/libs/topojson/2.2.0/topojson.min.js"></script>
           <!-- JS–––––––––––––––––––––––––––––––––––––––––––––––––– -->
           <script src="https://ajax.googleapis.com/ajax/libs/jquery/2.1.1/jquery.min.js"></script>
           <script src="https://maxcdn.bootstrapcdn.com/bootstrap/3.3.7/js/bootstrap.min.js"></script>
           <script>
           var svg = d3.select("svg"),
               width = +svg.attr("width"),
               height = +svg.attr("height");

               var format = d3.format(",d");

               var color = d3.scaleOrdinal(d3.schemeCategory10);

               var pack = d3.pack()
                   .size([width, width])
                   .padding(1.5);

               var inputs = {};

               d3.csv("austin_fsq.csv", function(d) {
                   d.sno = +d.sno;
                   return d;
               }, function(error, data) {
                   if (error) throw error;

                   d3.selectAll("input").on("change", function(){
                     inputs[this.id] = +this.value;
                     console.log(inputs.myValue + "-" + inputs.myRating)
                     if(inputs.myValue && inputs.myRating){
                        var classes = data.filter(d => d.value < inputs.myValue && d.rating >= inputs.myRating);
                       draw(classes);
                     }
                   })

                   function draw(classes) {

                     d3.selectAll("svg > *").remove();

                       console.log(classes.length);
                       var root = d3.hierarchy({
                               children: classes
                           })
                           .sum(function(d) {
                               return d.value;
                           })
                           .each(function(d) {
                               if (id = d.data.id) {
                                   var id, i = id.lastIndexOf(".");
                                   d.id = id;
                                   d.package = id.slice(0, i);
                                   d.class = id.slice(i + 1);
                               }
                           });

                       var node = svg.selectAll(".node")
                           .data(pack(root).leaves())
                           .enter().append("g")
                           .attr("class", "node")
                           .attr("transform", function(d) {
                               return "translate(" + d.x + "," + d.y + ")";
                           });

                       node.append("circle")
                           .attr("id", function(d) {
                               return d.id;
                           })
                           .attr("r", function(d) {
                               return d.r;
                           })
                           .style("fill", function(d) {
                               return color(d.package);
                           });

                       node.append("clipPath")
                           .attr("id", function(d) {
                               return "clip-" + d.id;
                           })
                           .append("use")
                           .attr("xlink:href", function(d) {
                               return "#" + d.id;
                           });

                       node.append("text")
                           .attr("clip-path", function(d) {
                               return "url(#clip-" + d.id + ")";
                           })
                           .selectAll("tspan")
                           .data(function(d) {
                               return d.class.split(/(?=[A-Z][^A-Z])/g);
                           })
                           .enter().append("tspan")
                           .attr("x", 0)
                           .attr("y", function(d, i, nodes) {
                               return 13 + (i - nodes.length / 2 - 0.5) * 10;
                           })
                           .text(function(d) {
                               return d;
                           });

                       node.append("title")
                           .text(function(d) {
                               return d.data.id + "\n" + format(d.value);
                           });
                   }
               });
           </script>