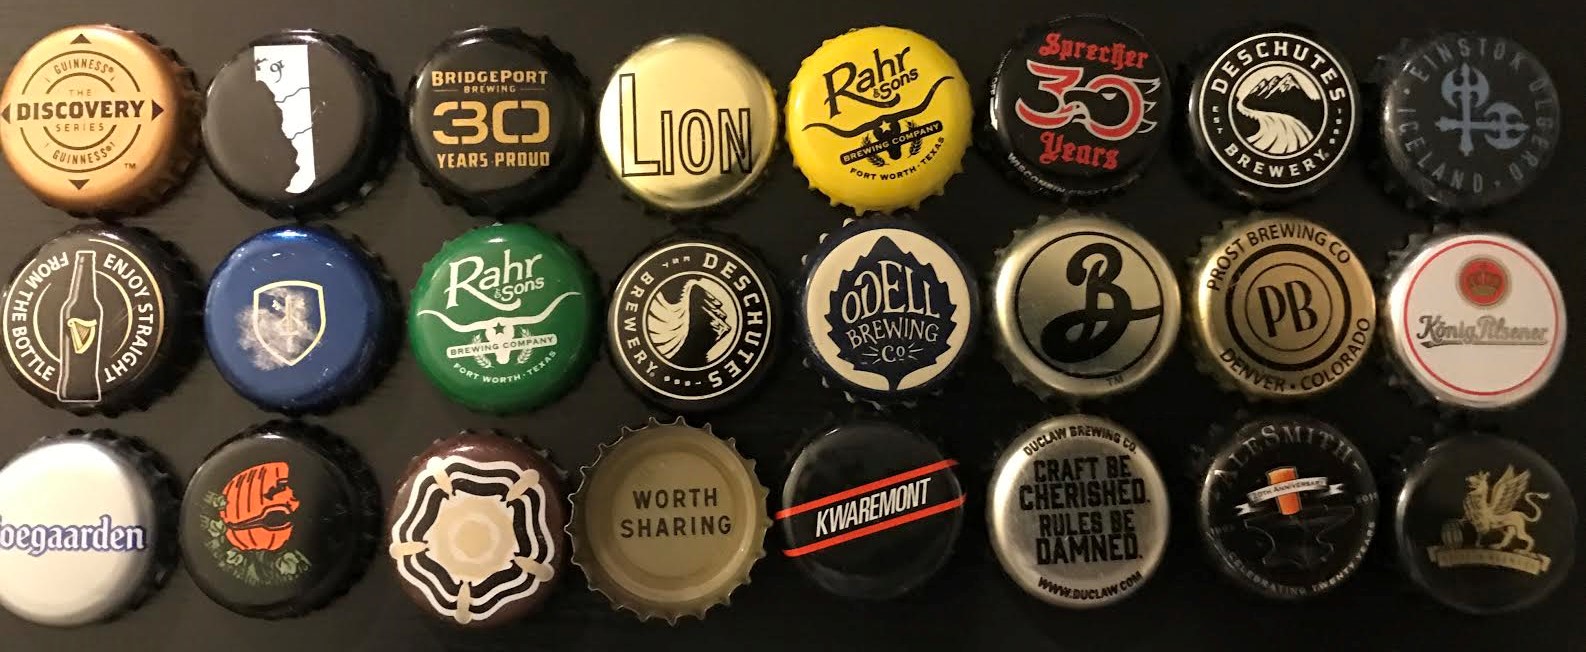
After completing my previous post on food I wanted to work on something which I have started to explore recently,craft beer. A friend of mine introduced me to a beer club membership prior to which I never knew anything beyond the Corona’s . Then began the collection and here it is, what have so far.
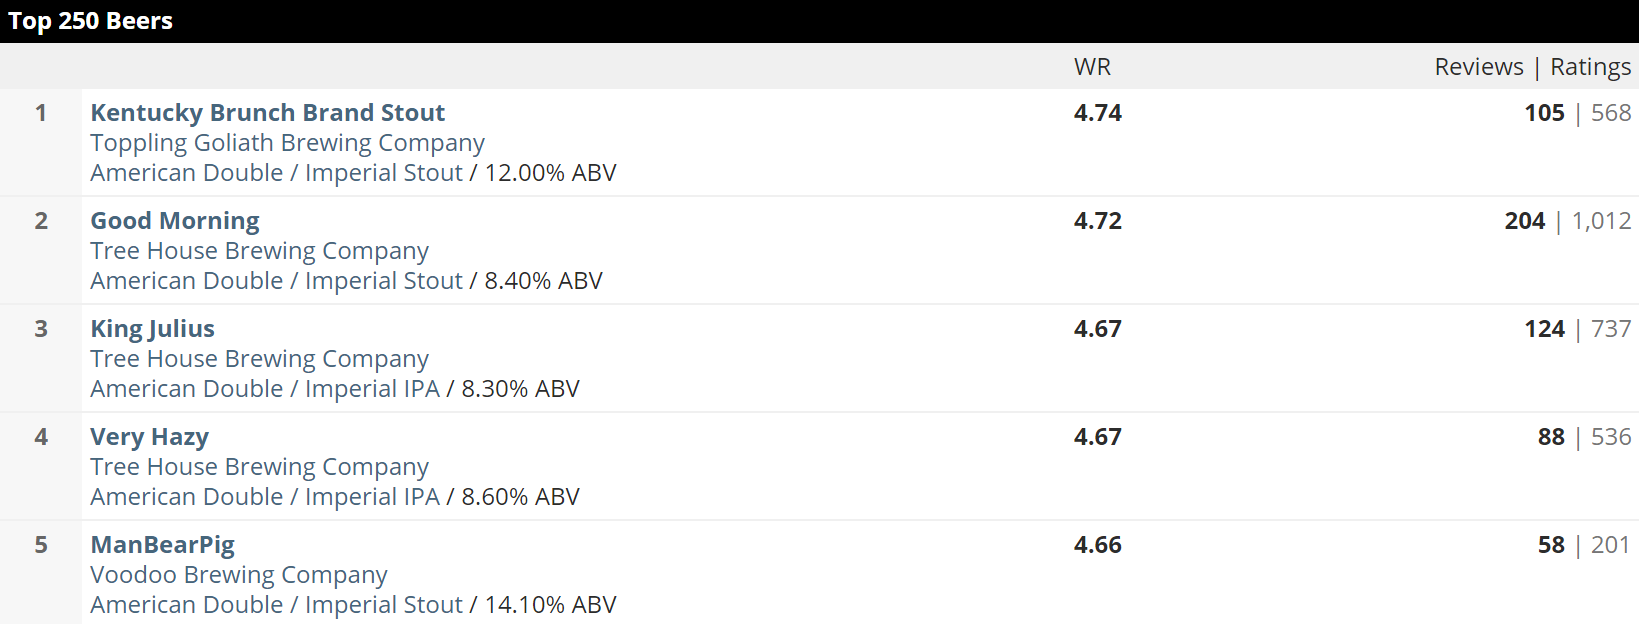
So when I started searching for the data google lead me to Beer Advocate. Below is how the raw html table from the website looked like.
I have used R to scrape the table from the website using R. The library I am using here to scrape is Rvest. Below is the code on how to get the data.
 library("rvest")

                    # Enter the url below
                    url <- "https://www.beeradvocate.com/lists/top/"

                      beer <- url %>%
                      html() %>%

                      ## to get xpath for a table ,right click on the table,inspect,
                      ## go to the table tag ,right click again and go to copy xpath .. phew ...
                      ## not clear click here for <a href="http://www.wikihow.com/Find-XPath-Using-Firebug">more details</a>

                      html_nodes(xpath = '//*[@id="extendedInfo"]/a[1]') %>%
                      html_table()
                      beer <- beer[[1]]

                      head(beer)
                      write.table(
                        beer,
                        file = "topus250.csv",
                        quote = TRUE,
                        sep = ",",
                        row.names = FALSE
                    )
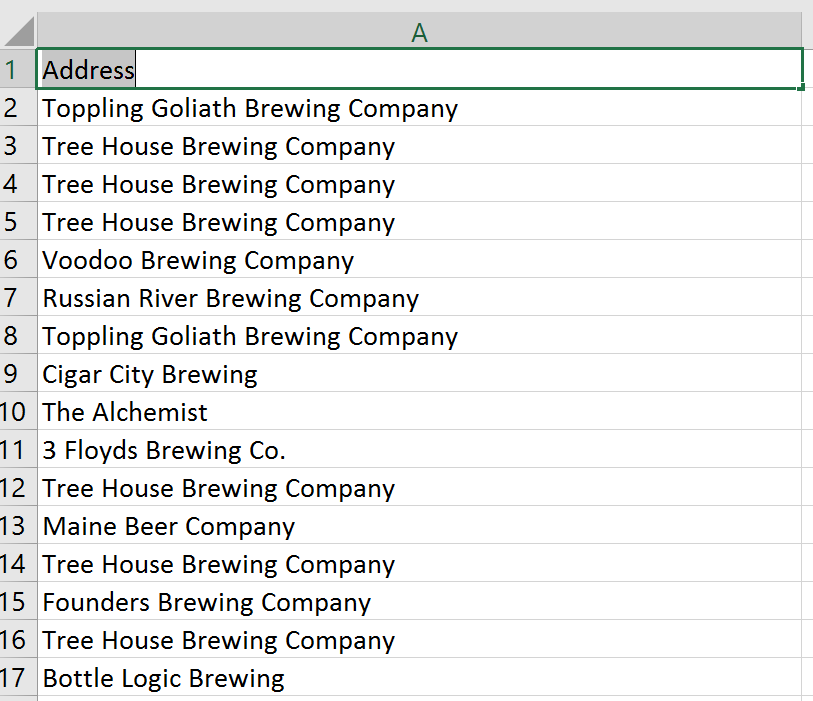
Now that I got the scraped data and address parameter as the name of the brewing company , it looks something like this.
The next step here is to get the address geocoded which would help me plot this on a map . For this I have used the library ggmap.
 library("rvest")
 library(ggmap)

                 # Read in the CSV data and store it in a variable
                  origAddress <- read.csv("topus250.csv", stringsAsFactors = FALSE)

                  # Initialize the data frame
                  geocoded <- data.frame(stringsAsFactors = FALSE)

                  # Loop through the addresses to get the latitude and longitude of each address
                  # and add it to the origAddress data frame in new columns lat and lon

                  for(i in 1:nrow(origAddress))
                  {
                    # Print("Working...")
                    result <- geocode(origAddress$Address[i], output = "latlona", source = "google")
                    origAddress$lon[i] <- as.numeric(result[1])
                    origAddress$lat[i] <- as.numeric(result[2])
                    origAddress$geoAddress[i] <- as.character(result[3])
                    origAddress$state[i] <- as.character(result[3])
                  }

                  # Save the output as csv to the working directory
                  write.csv(result, file = geocoded.csv)
Now I got the data cleaned, gecoded and ready to plot it on the map. Another task …another library. Here I have used the leaflet library to add the basemap,plot the points , add clusters and markers to it. All it took was a couple of lines in R !! As a continuation to this project.
library(leaflet)
library(dplyr)
lf <-
read.csv("beer_lat_long.csv", stringsAsFactors = FALSE) # Brings in the file 'ctlist.csv'
map <-
leaflet(lf) %>% addTiles('http://{s}.basemaps.cartocdn.com/dark_all/{z}/{x}/{y}.png',
attribution = 'Map tiles by <a href="http://stamen.com">Stamen Design</a>, <a href="http://creativecommons.org/licenses/by/3.0">CC BY 3.0</a> — Map data © <a href="http://www.openstreetmap.org/copyright">OpenStreetMap</a>')
map %>% setView(-95.712891, 37.09024, zoom = 5)
#add cluster
map %>% addMarkers(
popup = paste(
"Brewer:",
lf$company,
"Beer Name:",
lf$name,
"Rank:",
lf$rank
),
clusterOptions = markerClusterOptions()
)